

Community data
See how your community is growing, who takes part, when people are active and what they talk about — aggregate numbers only, with an optional AI analysis of trending topics.
Watch the lesson
Community data is the dashboard of your community: growth, participation, where members are from, peak hours, top posts and, with AI, the topics people are talking about. Only the owner and admins see it.
Where to find it
Settings → Community data (under "People"). Choose the period at the top: 7 days, 30 days or 90 days. Each number is compared with the previous period of the same length.
What you see
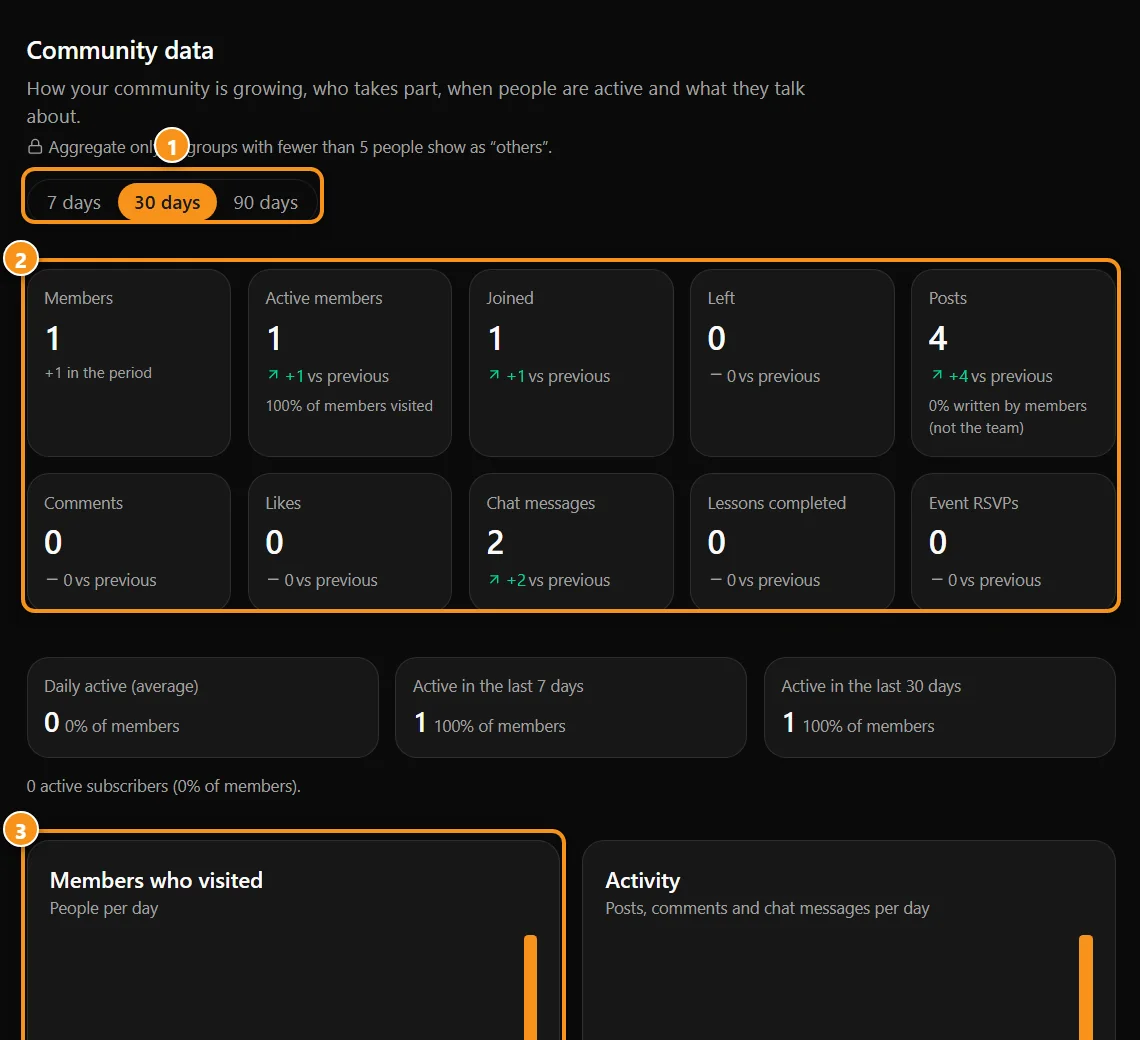
1 period · 2 the numbers · 3 charts
- Members, Active members (who visited in the period), Joined and Left.
- Posts, Comments, Likes, Chat messages, Lessons completed and Event RSVPs. Under Posts you see how many were written by members and not by the team.
- Daily active (average), Active in the last 7 days and Active in the last 30 days, with the share of members.
- Active subscribers, when your community has subscriptions.
Charts
- Members who visited: people per day.
- Activity: posts, comments and chat messages per day.
- Joined and left: per day, joined above and left below.
- Peak hours: the days and times people post and chat, shown in your time zone. Schedule lives, events and important posts for the busiest hours.
- Top posts of the period and the Topics with the most posts and comments.
- Countries, Languages and Time in the community.
- Retention: of the members who joined each week, how many came back 1, 2 and 4 weeks later.
Hover over a bar or a cell to see the exact number.
Privacy
The dashboard only shows aggregate numbers. Any group with fewer than 5 people — a country, a language, a city, a weekly group of new members — is merged into "Others" or shown without a percentage, so nobody can be identified. Countries and cities come from what members chose to show in their profile; the rest shows as "Not informed".
Trending topics (AI)
Tap Analyze with AI and the AI reads a sample of what was written in the period — posts, comments and chat, without names. It shows:
- the main topics, with an approximate share of the conversation and whether the mood is positive, neutral, negative or mixed;
- the questions members keep asking;
- content ideas based on what members want;
- the general mood.
Each analysis costs 10 credits and stays saved for 24 hours for that period and language — opening it again in that time is free. In company mode it's included in your plan. Use it as a guide, not as exact numbers.
Tips
- Look at Active members, not only at Members: a smaller community where most people visit is healthier than a big one where few come back.
- Low week-1 retention? Improve the welcome: a pinned post, a first lesson, a question for newcomers.
- Turn the questions from the AI analysis into posts, lessons or a live Q&A.
Updated 2026-10-15